09. PPG SNR
ppg snr 1
Signal Quality Evaluation
The single most important factor that can make or break any algorithm you build is the underlying quality of the signal. As an algorithms engineer you may have the rare opportunity to influence the design of the hardware that will acquire the signal that will then be the input to your algorithms. Being able to provide actionable quantitative feedback for various hardware prototypes will provide endless returns down the line when you start building algorithms based on that hardware.
We can see an example of this kind of analysis in this paper where the researchers analyzed the effects of different mediums (water vs. air) and temperature on the PPG signal quality and pulse rate estimation from a smartphone sensor.
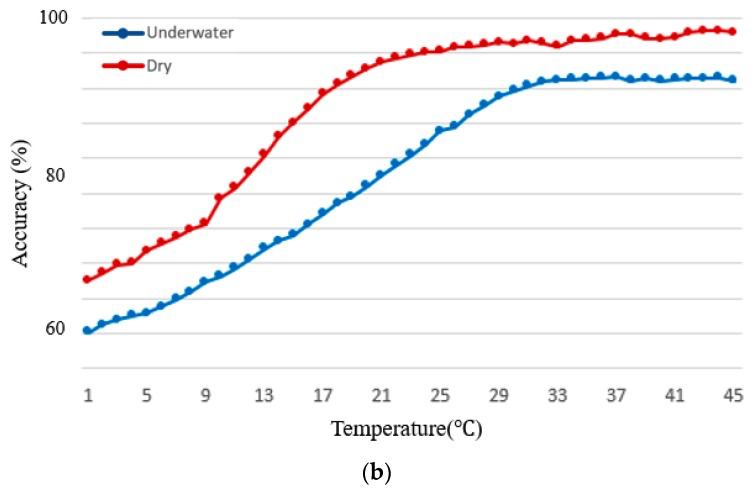
First let’s look at the pulse rate algorithm accuracy.
ppg snr image 1

Pulse rate accuracy acquired from smartphone PPG signals for varying temperature in dry (red) and underwater (blue) environments.
ppg snr 2
Pulse rate accuracy deteriorates at cooler temperatures and is worse underwater compared to in air.
Using a pulse rate algorithm’s accuracy is a great way to evaluate signal quality, especially if the primary thing you want to do with that signal is estimate pulse rate and if you have the algorithm on hand. However, using an algorithm to estimate signal quality can conflate the algorithm accuracy and its idiosyncrasies with the signal quality. Sometimes you may want to look directly at the signal characteristics themselves. Here, the researchers chose to look at signal amplitude.
ppg snr image 2
Smartphone PPG signal amplitude for varying temperature in dry (red) and underwater (blue) environments.
ppg snr 3
Again we observe that we get higher amplitudes in dry and warmer environments. This plot implies that a higher signal amplitude corresponds to higher signal quality. But as we have seen previously, with PPG signals, this is not always the case. Motion artifact and ambient light can cause high amplitude peaks in the signal that definitely do not correspond to signal quality. Optimizing for signal amplitude might mean that you build hardware that is extremely susceptible to motion artifacts.
In the following exercise you will use a more holistic metric to evaluate PPG signal quality called the signal-to-noise ratio that avoids some of these problems.
summary & Exercise
Exercise 3: PPG SNR
Instructions
- Complete the Offline or Online instructions below.
- Read through the whole
.ipynb. - Complete all the code cells that contain
## Your Code Goes Here.
Offline
- In the repo which you can access here in the repo
/intro-to-sensors/exercises/2-ppg-snr/you should find the following files:
3_ppg_snr.ipynbexercise3.npz
- Open up the python notebook and associated files in your desired editor.
Note: Instructions can be found in Introduction to Wearable Data's Concept Developer Workflow for how to set up your local environment.
Online
- Go to the next concept and the
3_ppg_snr.ipynbshould be open and the workspace should already contain the appropriateexercise3.npzfile. This one will also contain theppg_peaks.pngfile for the instructions in markdown.